
ANALYTICS & DATA
GA4 Analytics Dashboard Development Using Looker Studio
Created an interactive Looker Studio dashboard connected with Google Analytics 4 to visualize e-commerce performance metrics, user behavior, traffic sources, and conversion data.
Project Objectives
The main objectives of this project were:
- Connect GA4 data source with Looker Studio.
- Build a customized analytics reporting dashboard.
- Visualize important e-commerce performance metrics.
- Monitor user acquisition and website engagement.
- Create a simplified reporting system for business analysis.
- Present GA4 data in a more actionable format.
My Role
I independently connected Google Analytics 4 with Looker Studio, selected relevant dimensions and metrics, designed the dashboard layout, created visual reports, and organized analytics data into a structured reporting format for easier performance analysis.
Project Overview
This project involved connecting Google Analytics 4 with Looker Studio to create a centralized analytics dashboard for a WooCommerce practice website.
The objective was to transform GA4 data into an easy-to-understand visual report containing important e-commerce metrics, user activity insights, traffic information, and website performance indicators.
The dashboard was designed to help businesses quickly understand website performance and make data-driven marketing decisions.
Implementation & Screenshots
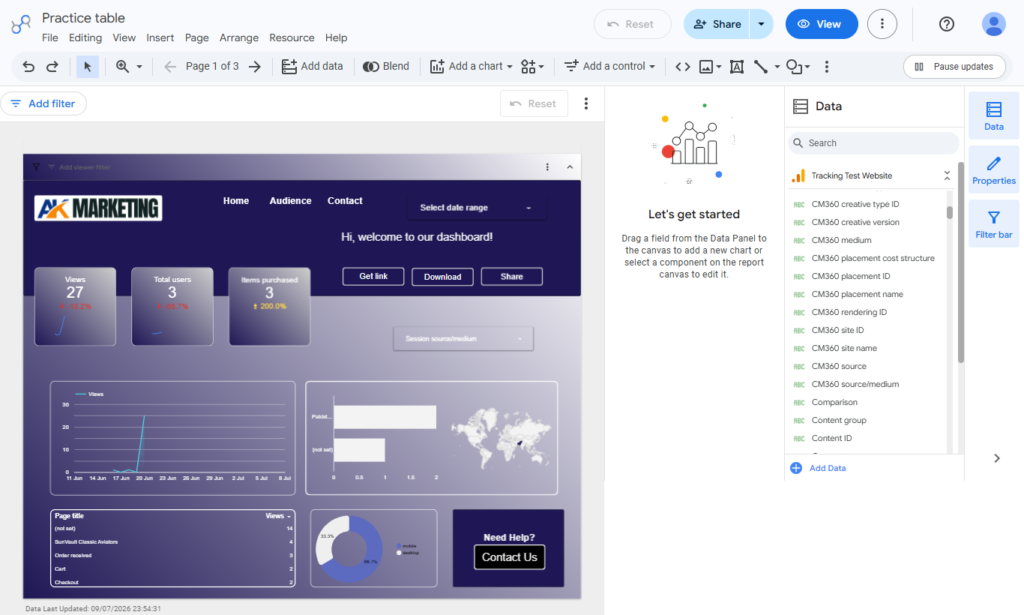

Looker Studio GA4 Analytics Dashboard
Designed a customized Looker Studio dashboard by connecting Google Analytics 4 with a WooCommerce practice website.
The report combines multiple GA4 data points into a single visual dashboard, including website views, users, purchased items, traffic sources, geographic data, device breakdown, and page performance.
The dashboard provides a simplified overview of website activity and helps identify important trends, user behavior patterns, and e-commerce performance insights.
Key Skills Demonstrated:
- Google Analytics 4 Reporting
- Looker Studio
- Data Visualization
- Dashboard Development
- E-commerce Analytics
- Performance Reporting
- Business Intelligence
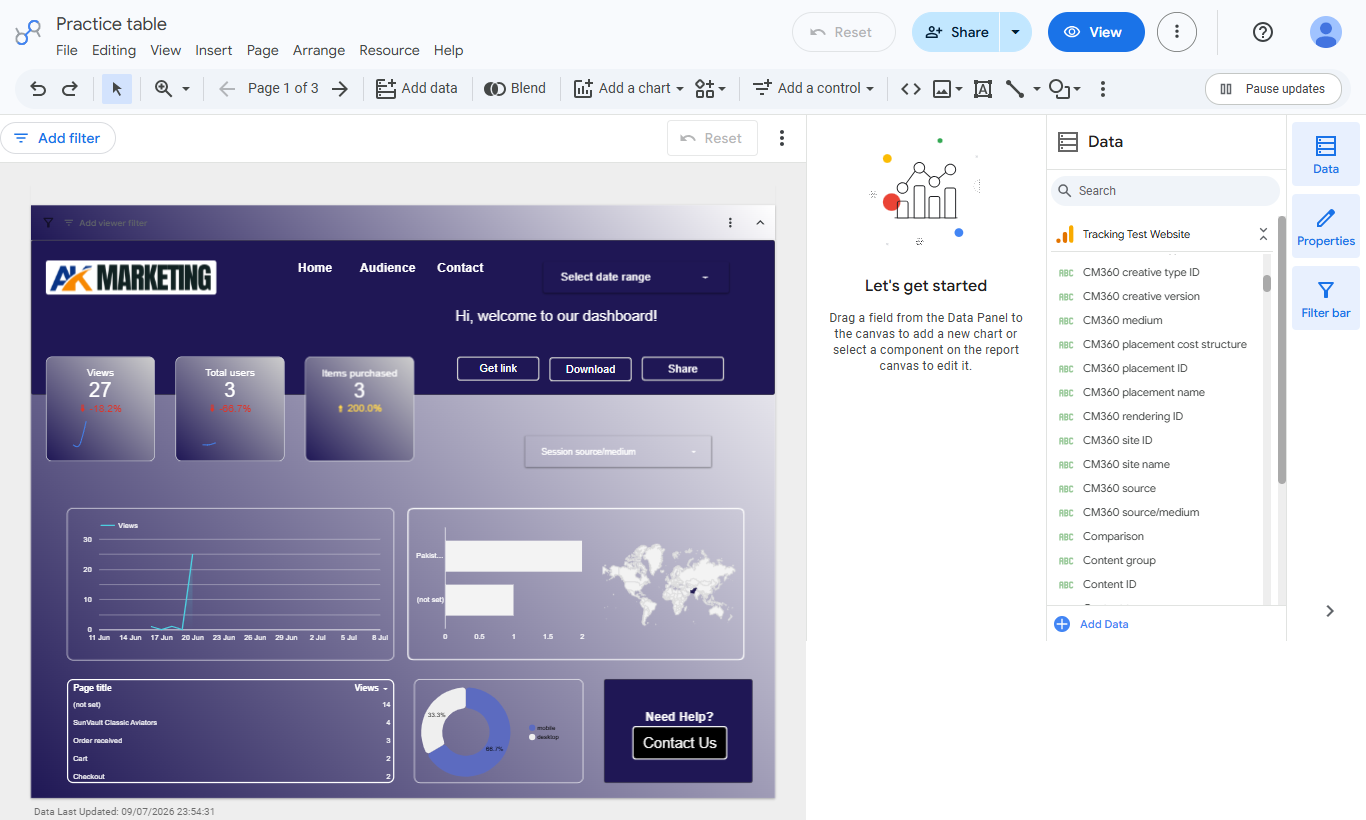
Dashboard Components Created
The report includes:
Website Performance Overview
- Total Views
- Total Users
- Items Purchased
- Performance trends
Traffic Analysis
- Session source/medium
- Acquisition insights
- Traffic performance
Audience Insights
- Geographic distribution
- Device breakdown
- User behavior
Page Performance
- Top viewed pages
- User navigation insights
- Website engagement analysis
Skills Demonstrated
- GA4
- Looker Studio
- Data Visualization
- Analytics Reporting
- Dashboard Design
- E-commerce Measurement
- KPI Tracking
- Marketing Analytics
- Data Interpretation
Implementation Workflow
- Connected Google Analytics 4 as a data source in Looker Studio.
- Selected relevant GA4 dimensions and metrics.
- Designed dashboard structure and layout.
- Created visual charts and KPI cards.
- Added e-commerce performance indicators.
- Organized data into an easy-to-understand reporting format.
- Validated that GA4 data was displaying correctly.
Challenges
The main challenge was converting a large amount of GA4 data into a clear and meaningful dashboard. Selecting the right metrics and organizing them in a business-focused format required understanding which data points are valuable for evaluating website performance and marketing effectiveness.
Result & Outcome
Successfully developed a Looker Studio analytics dashboard connected with Google Analytics 4, providing a centralized view of website performance and e-commerce activity. This project demonstrated practical experience in analytics reporting, data visualization, and transforming tracking data into actionable business insights.
Interested in working together?
I help businesses with data-driven marketing, accurate tracking and high-performaing ad campaigns.